In this post, I’m trying to compare SharePoint 2016 Web Application limits with SharePoint 2013 / 2010 / 2007.

It’s also recommended to read SharePoint 2019 Limitations.
SharePoint 2016 Web Application Limits compared to SharePoint 2013
The following table lists the recommended guidelines for Web Application in SharePoint 2016, SharePoint 2013, SharePoint 2010, and SharePoint 2007.
| limits | SharePoint 2007 | SharePoint 2010 | SharePoint 2013 | SharePoint 2016 |
| Web application | 99 per SSP | × | 20 per farm | 20 per farm |
| Content database | 100 per web app | 300 per web app | 500 per farm | 500 per farm |
| Zone | 5 per farm | 5 per web app | 5 per web app | 5 per web app |
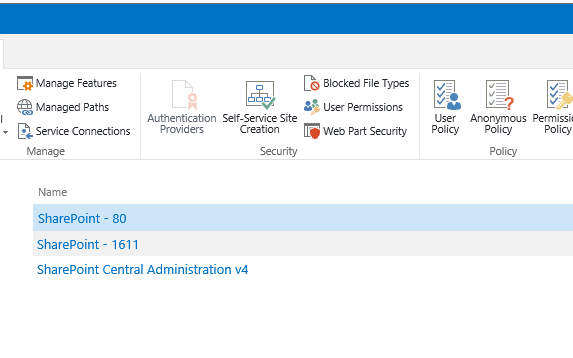
| Managed path | 20 per web app | 20 per web app | 20 per web app | 20 per web app |
| Solution cache size | × | 300 MB per web app | 300 MB per web app | 300 MB per web app |
| Site collection | 150,000 per web app | 250,000 per web app | 250,000 per web app | 250,000 per web app |
You might also like to read Get All Web Applications and Application Pools Per Farm
Applies To
- SharePoint 2016.
- SharePoint 2013.
- SharePoint 2010.
- SharePoint 2007.
Download
- Download PowerShell Script: SharePoint Farm Scan Report to get statistics and monitor the limits in your SharePoint farm.


Thanks for the worth article. I was actually looking for that information.